Browse Resources
Audio/Visual -- Image/Image Set
Resources | |
|---|---|
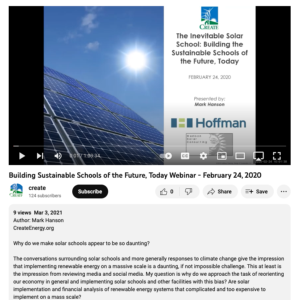
This webinar is presented by Mark Hanson and is based on Hanson's book The Inevitable Solar School: Building the Sustainable Schools of the Future, Today. During the webinar, Hanson "describes solar schools at or approaching zero energy that are being built at construction costs equal to or below...
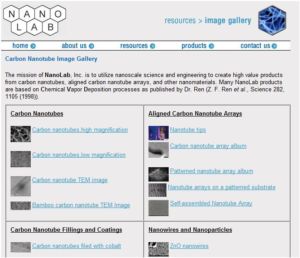
This NanoLab webpage provides nanoscience images. Images include carbon nanotubes, nanoparticles, nanowire, as well as nanotube fillings, coatings, and arrays.
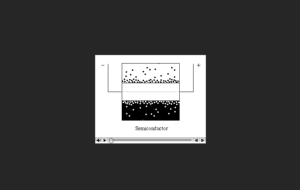
This online video is an animation of carrier flow in a semiconductor. Electrons move about on both sides of the substrate, and positive and negative poles are shown. The semiconductor is sandwiched in-between opposing flows of electrons. This video runs 00:03 seconds in length and is free for...
This collection of promotional resources, published by Southside Virginia Community College, was used to recruit and retain students for the Center for Information Technology Excellence (CITE) Information Technology (IT) training program, which provides students with hands on IT training while...
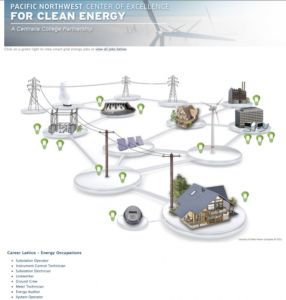
This page, produced through a partnership between Washington State University and University of Washington and funded by the Department of Energy, contains an interactive diagram that illustrates how a variety of clean energy careers are related to each other. These include Substation Operator,...
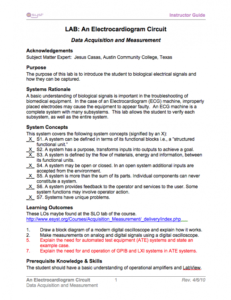
This collection is provided by eSyst and covers biological electrical signals. Instructor guides for Electrocardiogram Part 1 and 2 are included. "The purpose of this lab is to introduce the student to biological electrical signals and how they can be captured." The instructor guides contain a...
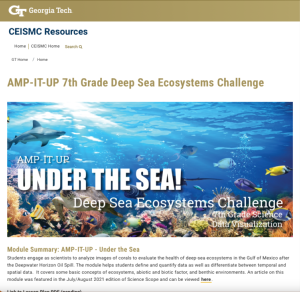
This resource, published by Georgia Tech Research Institute, features an ecology and data visualization activity designed for seventh graders. In this activity, students color-code and quantify data from images of coral to evaluate the health of coral impacted by the Deepwater Horizon Oil Spill. The...
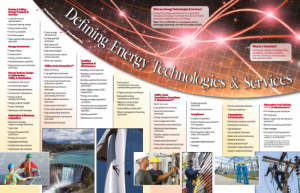
This chart is provided by the Advanced Technology Environmental and Energy Center (ATEEC) and is from the Defining Energy Technology and Services report. This careers chart provides a snapshot of the occupational areas and jobs within the energy technologies and services field. Some of the...
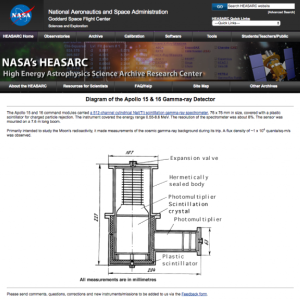
This is a diagram of the Apollo 15 & 16 Gamma-ray Detector from the NASA website. Primarily intended to study the Moon's radioactivity, the detector made measurements of the cosmic gamma-ray background during its trip. Measurements are in millimeters.
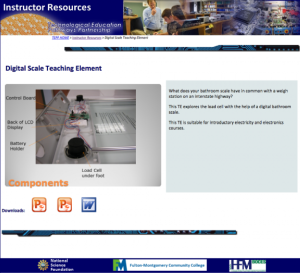
This lesson, from the Technological Education Pathways Partnership (TEPP), uses a bathroom scale to explore the load cell technology used in weigh stations on interstate highways. A Word document explains the concept of the Wheatstone bridge measure of electrical resistance, and two PowerPoint...
| |
| ← Previous | Next → |
